Regression Models and Significance
Fall 26
Calvin Williamson, Science and Math
Significant (\(p < .05\))
- There is a significant linear relationship between \(y\) and \(x\).
- You can use the regression equation for predictions, provided the accuracy is good enough.
- Graphically, there are enough data to be convinced about the trendline.
We say: The model is significant.
Not Significant (\(p \geq .05\))
- There is not a significant linear relationship between \(y\) and \(x\).
- You cannot use the regression equation for predictions.
- There may be too little data or too much scatter to be convinced about the trendline.
We say: The model is not significant.
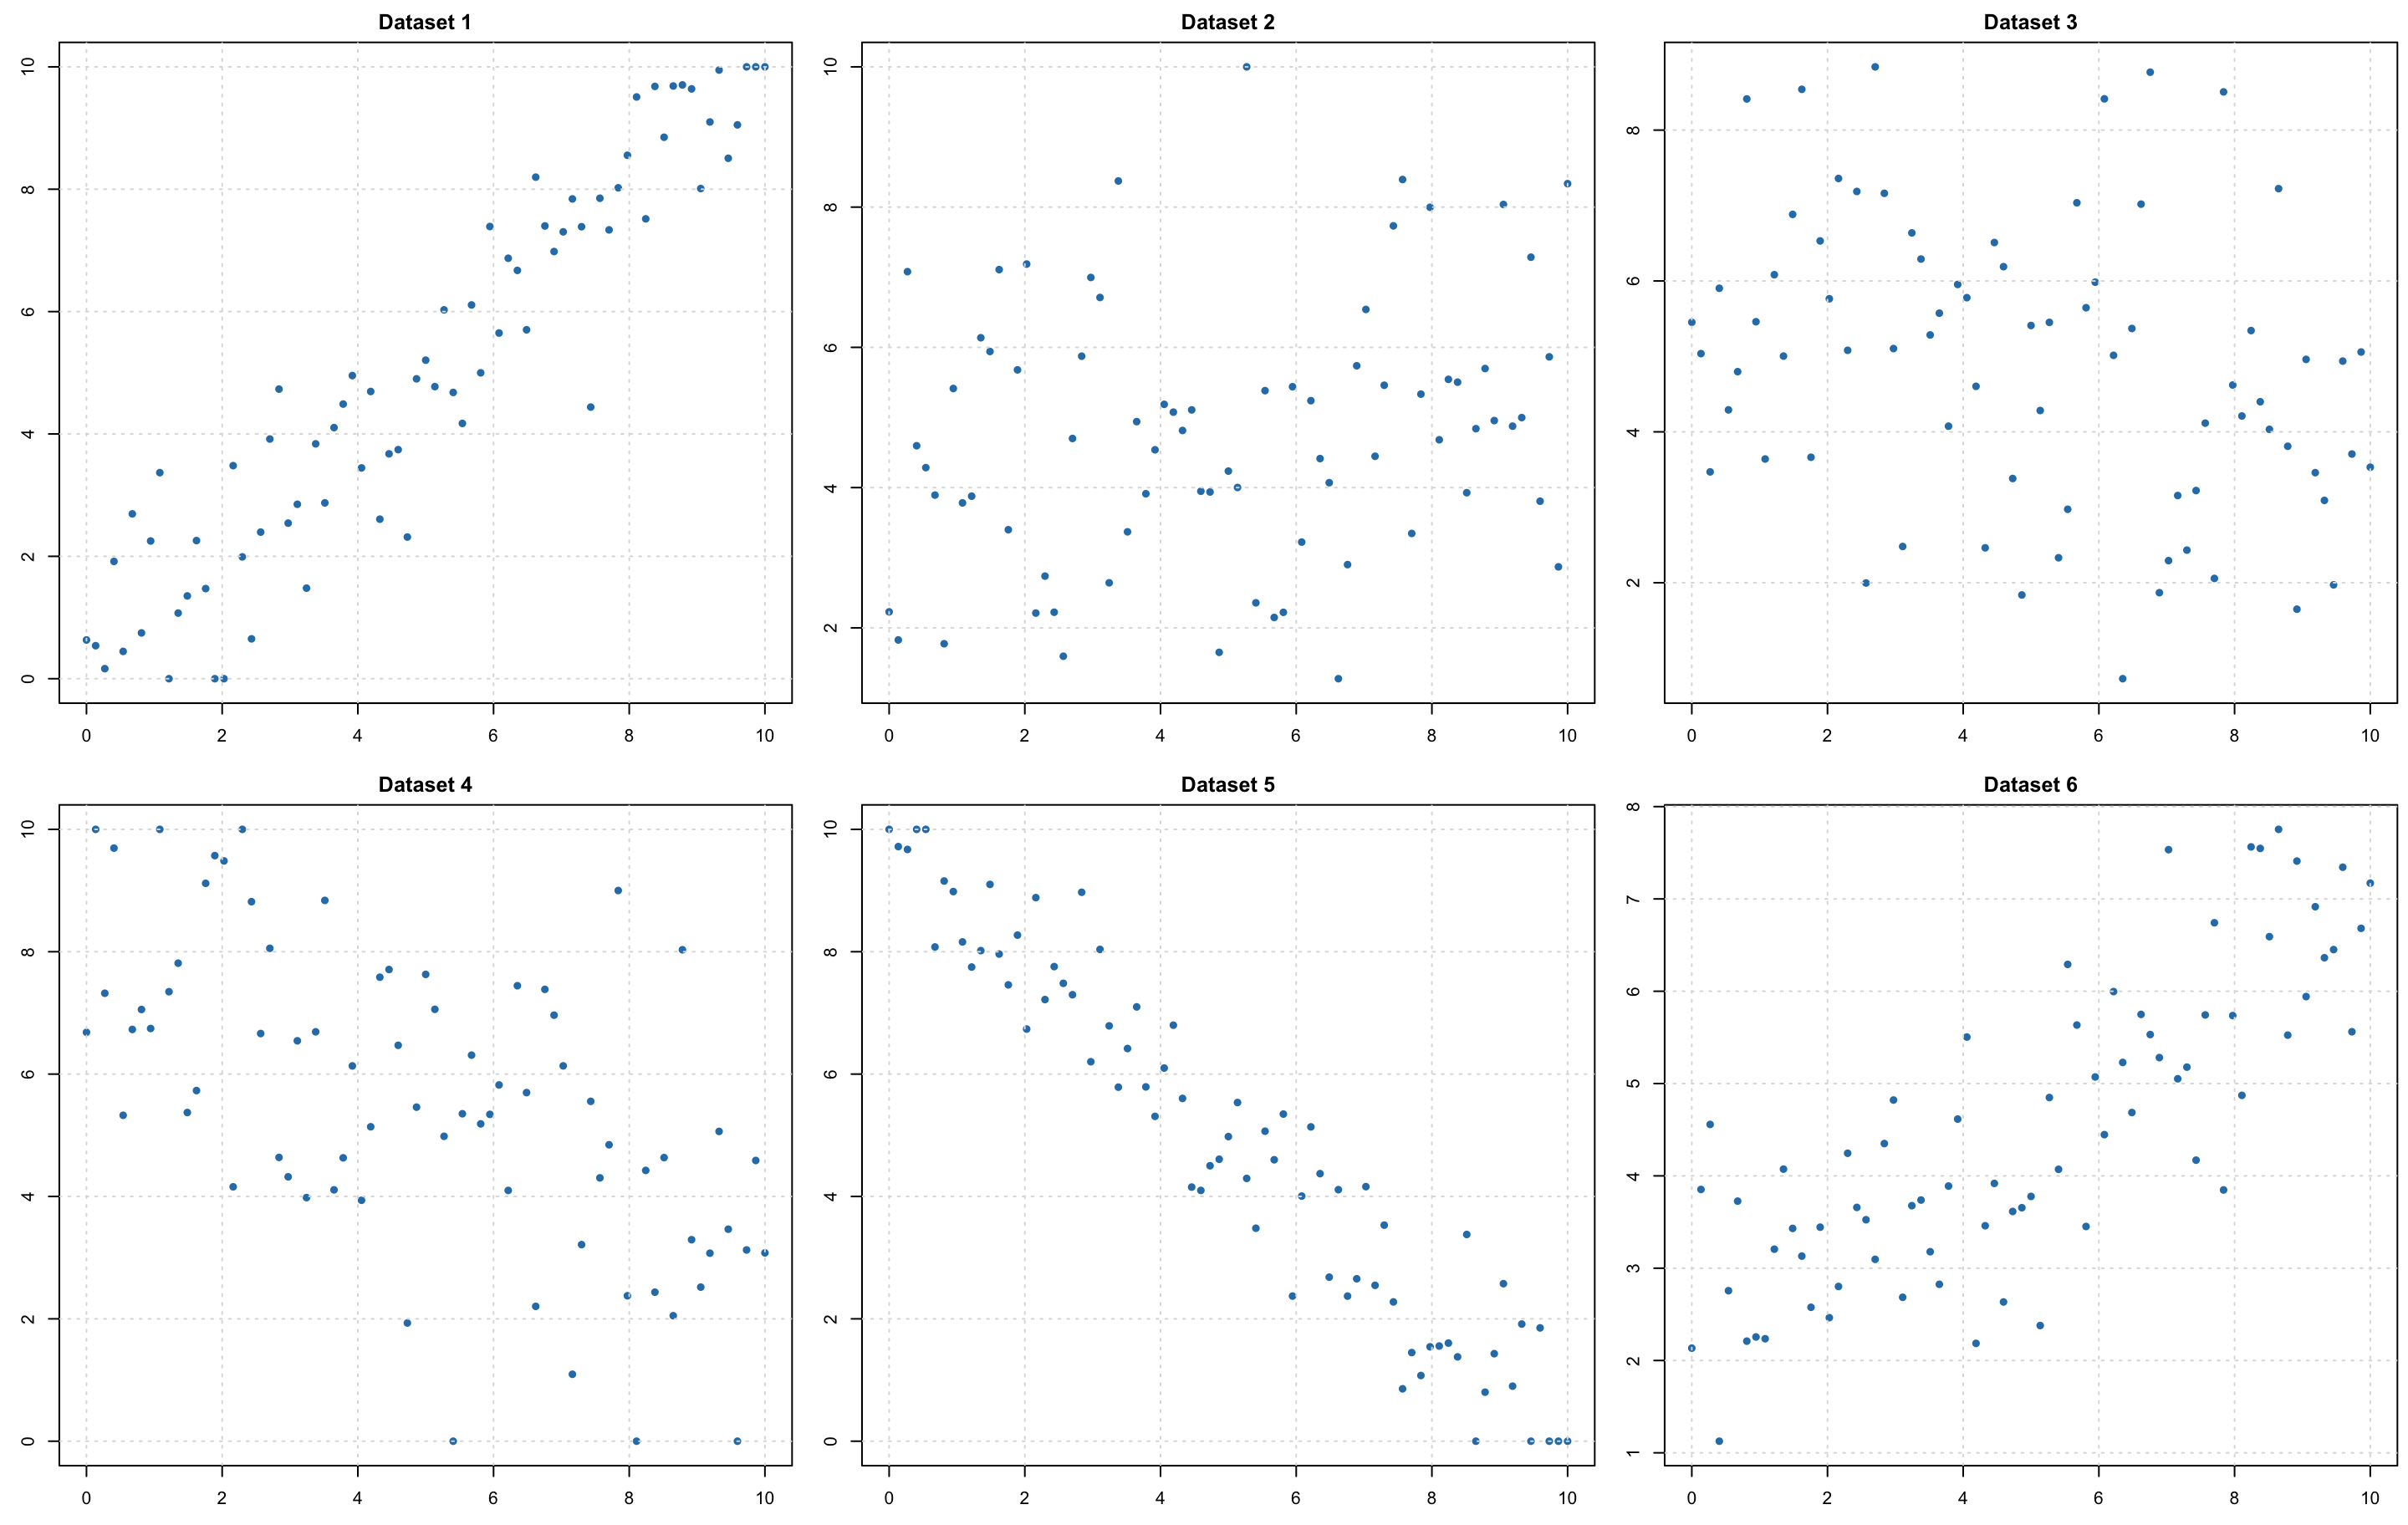
\(n=75\) Which are significant? Smallest p-value? Largest p-value?
![]()
Answers: 75 Observations
| 1 |
0.000000000000000000000000000000000002388 |
| 2 |
0.0517649238 |
| 3 |
0.0078590525 |
| 4 |
0.00000002386 |
| 5 |
0.000000000000000000000000000000000000000002225 |
| 6 |
0.000000000000000002059 |
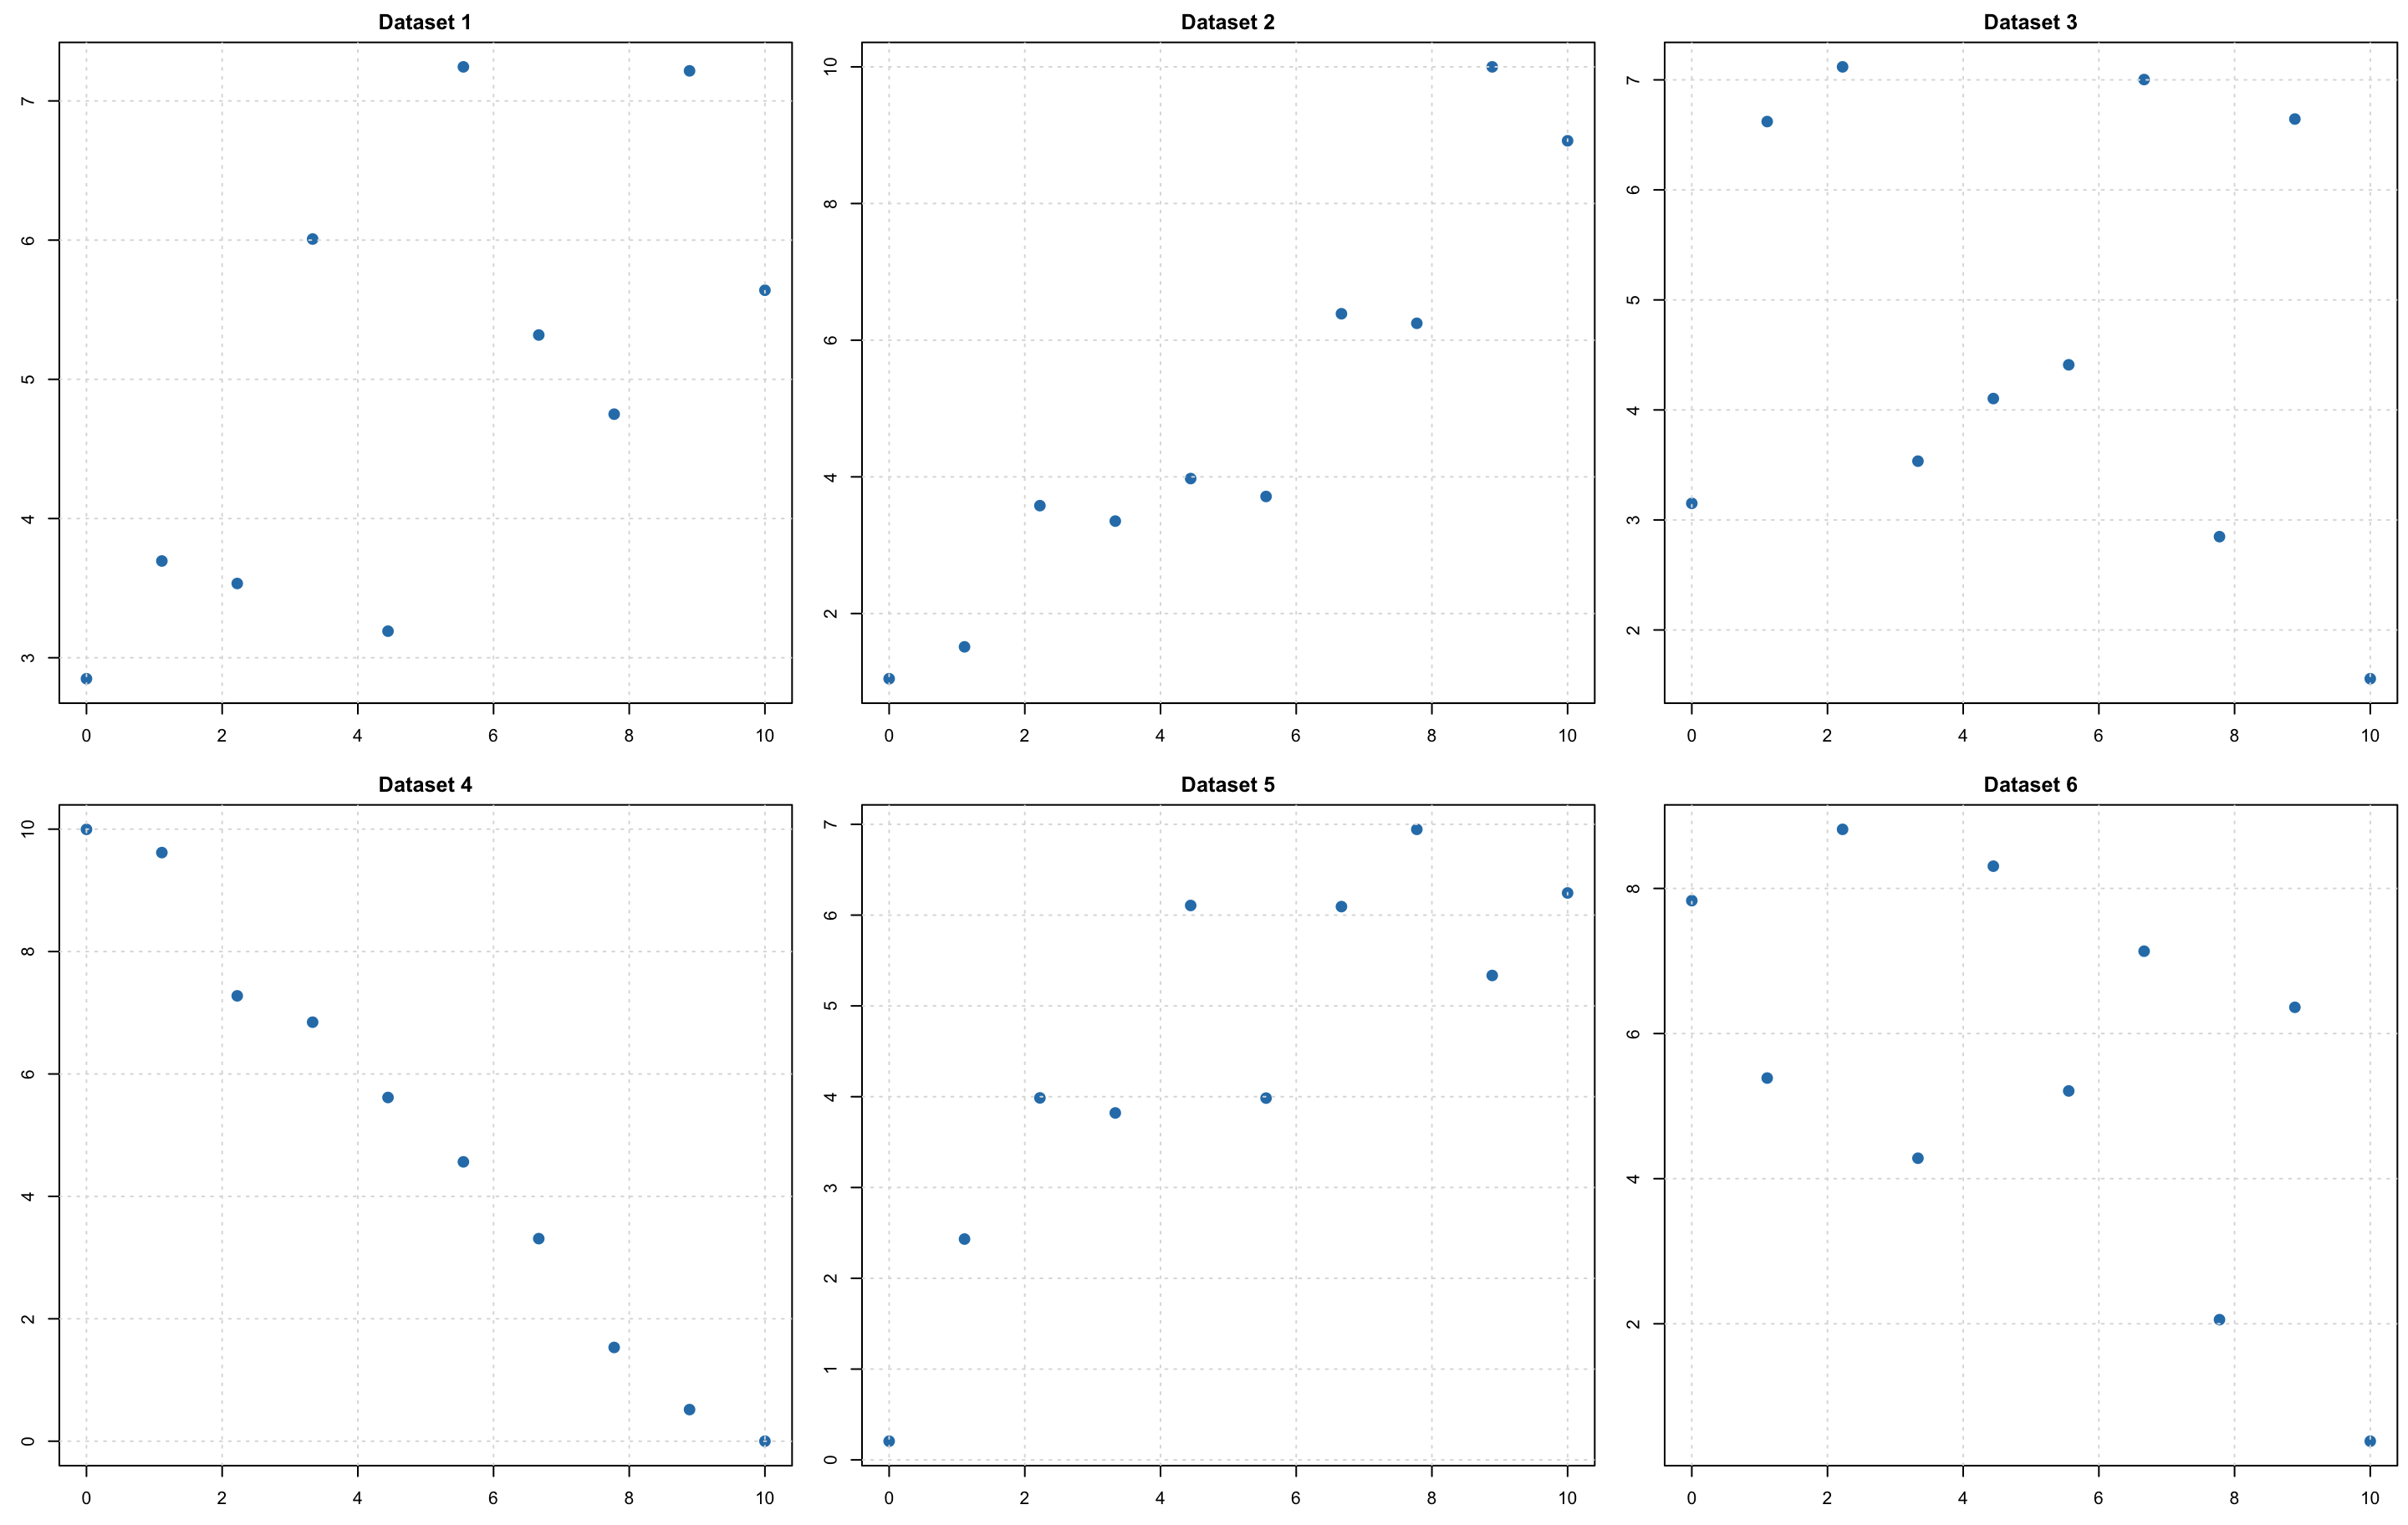
\(n=10\) Which are significant? Smallest p-value? Largest p-value?
![]()
Answers: 10 Observations
| 1 |
0.0378068969 |
| 2 |
0.0000382521 |
| 3 |
0.5276321321 |
| 4 |
0.000000003920 |
| 5 |
0.0026514978 |
| 6 |
0.0700447650 |
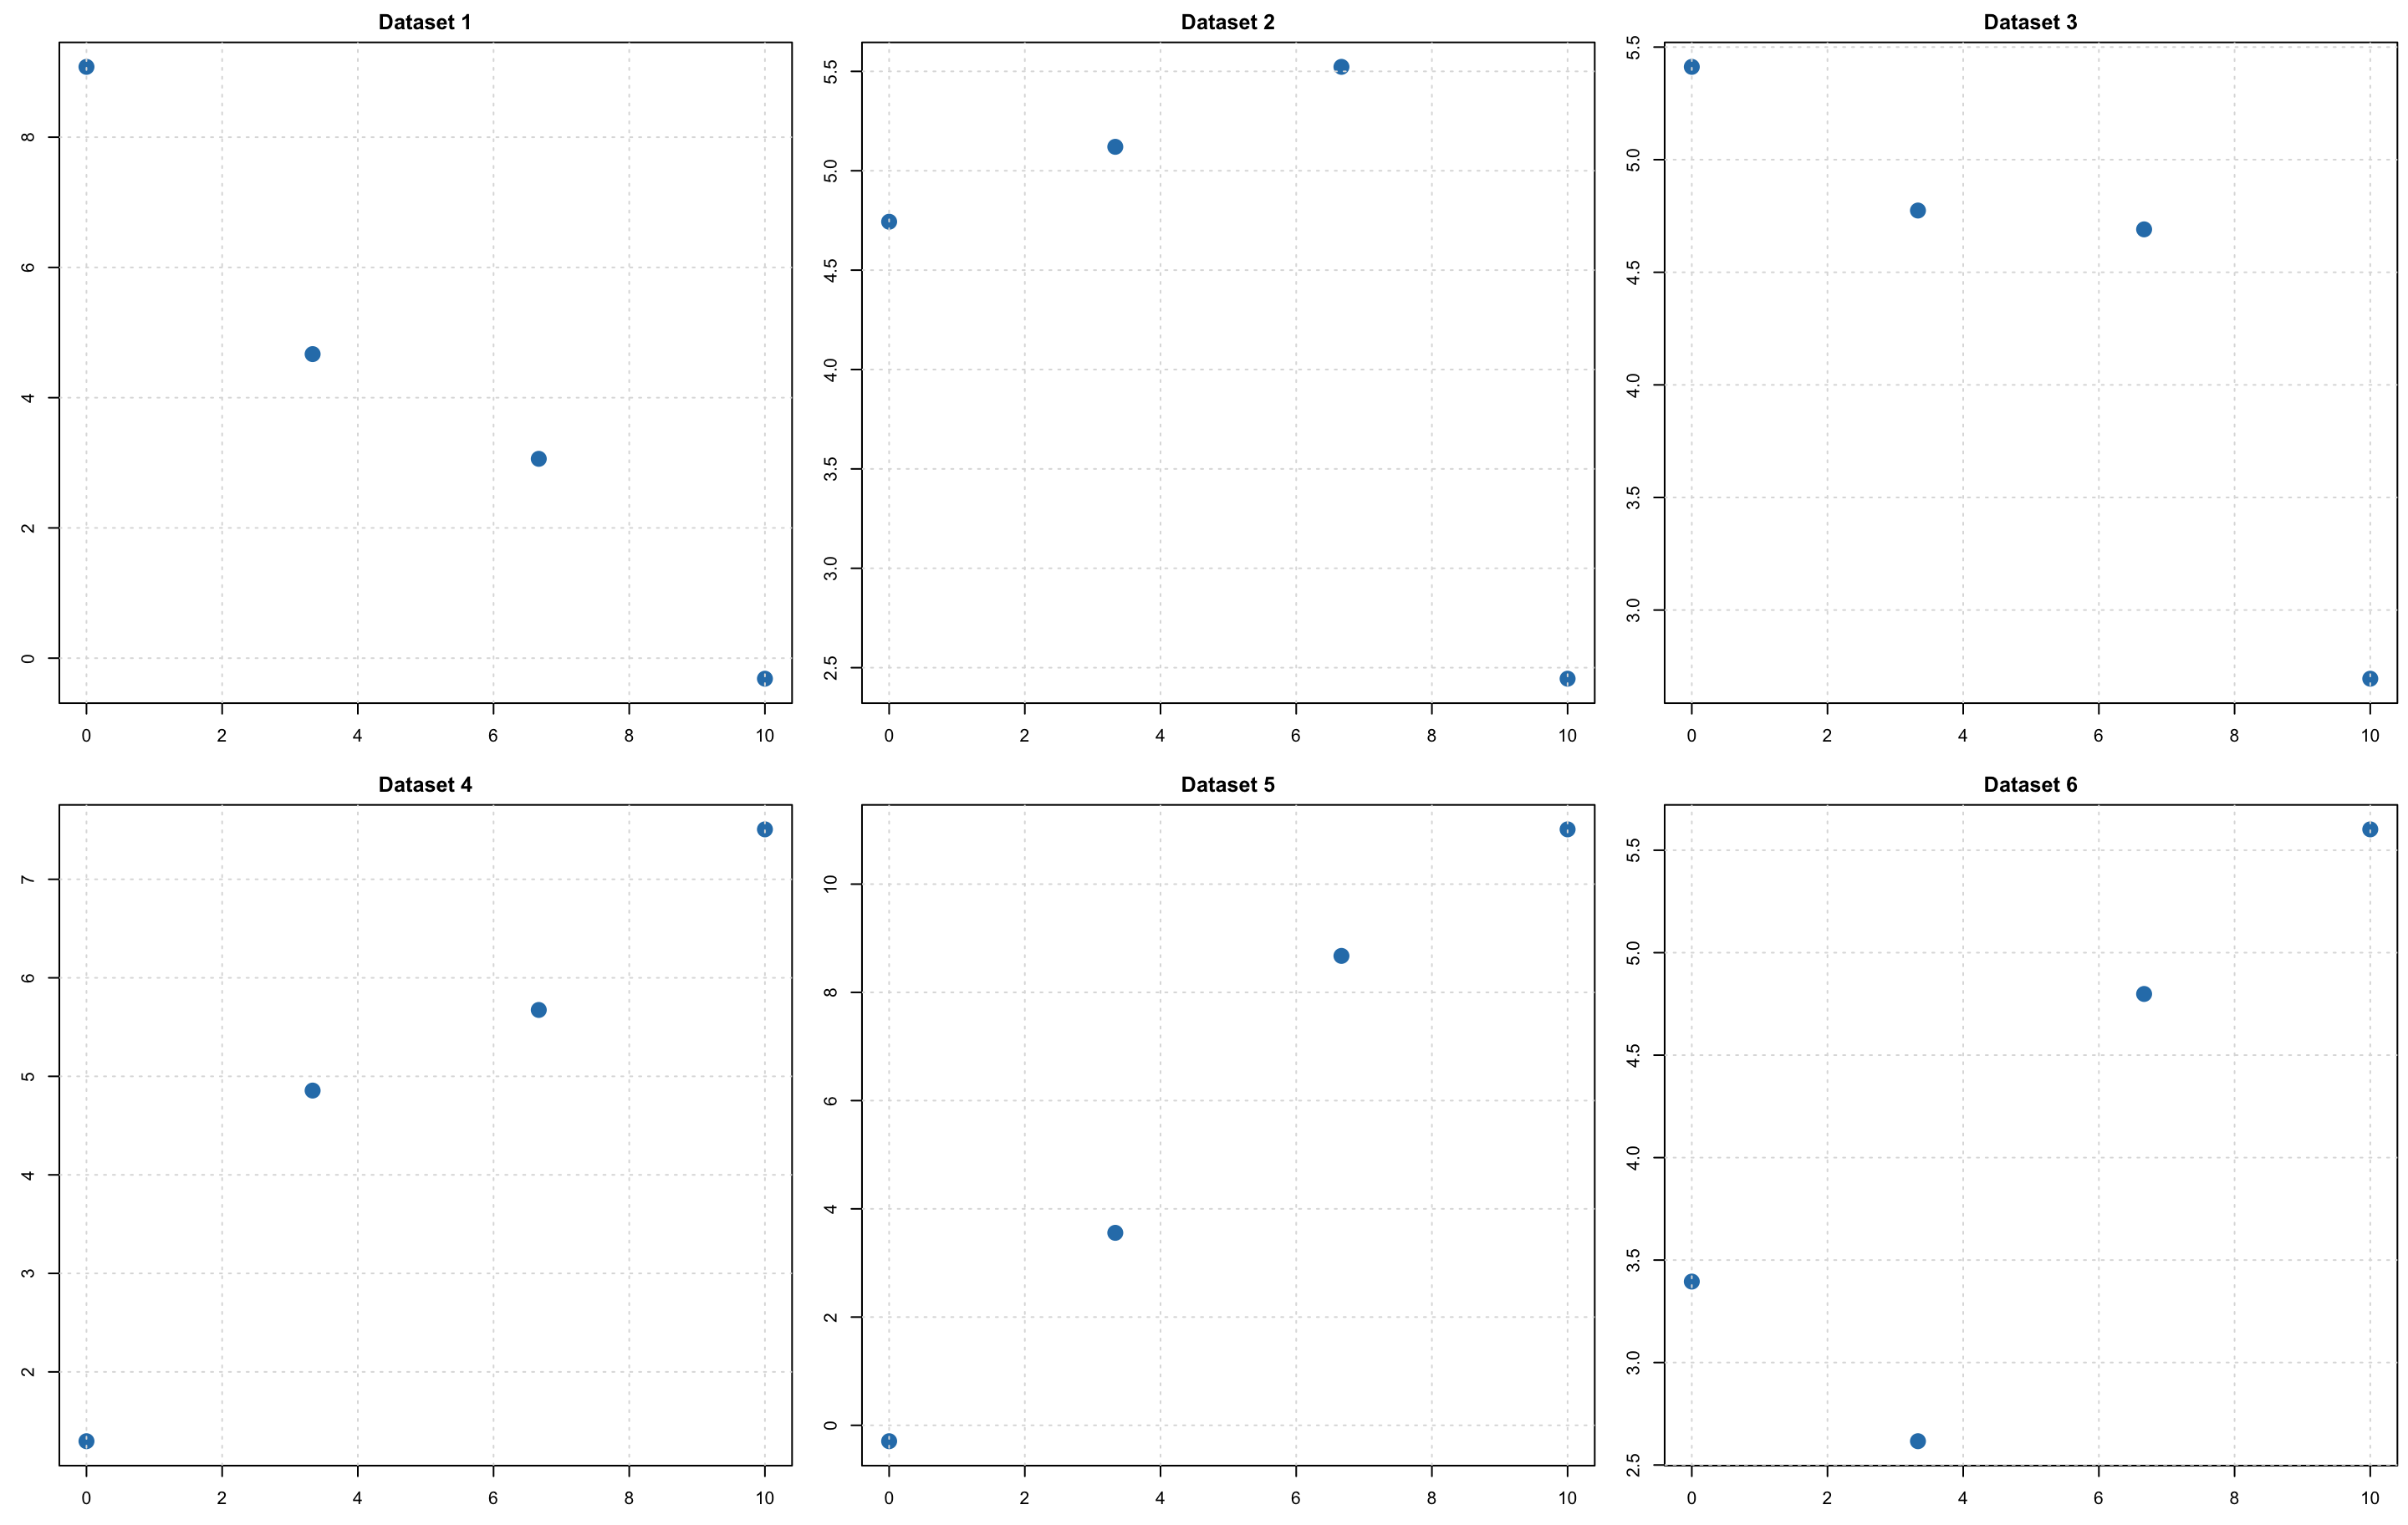
\(n=4\) Which are significant? Smallest p-value? Largest p-value?
![]()
Answers: 4 Observations
| 1 |
0.0144652791 |
| 2 |
0.3921505675 |
| 3 |
0.0966902838 |
| 4 |
0.0362557997 |
| 5 |
0.0089999328 |
| 6 |
0.1562506207 |
With very small samples, even an apparent trend may not provide enough evidence.
Sample Size and Significance
The same general strength of relationship can lead to different conclusions when the sample size changes.
- More observations give the test more information.
- Fewer observations make the location of the trendline less certain.
- The p-value combines the strength of the pattern with the amount of data.