
You might have wondered what \(r^2\) tells you in the regression analyses output. It tells you about how tight the fit is for your scatter.
The scatter affects the predictability and accuracy of your model. If you are using the regression equation to make predictions, you should be mindful if the \(r^2\) is low, and whether or not that will be an issue for your situation.
The question of whether the \(r^2\) is too low depends on the context and the situation. Sometimes it is unacceptable to have a low \(r^2\) but sometimes it is fine.
You will have to look at your situation to decide whether your model provides benefit even if it is not very accurate when it has a low \(r^2\).
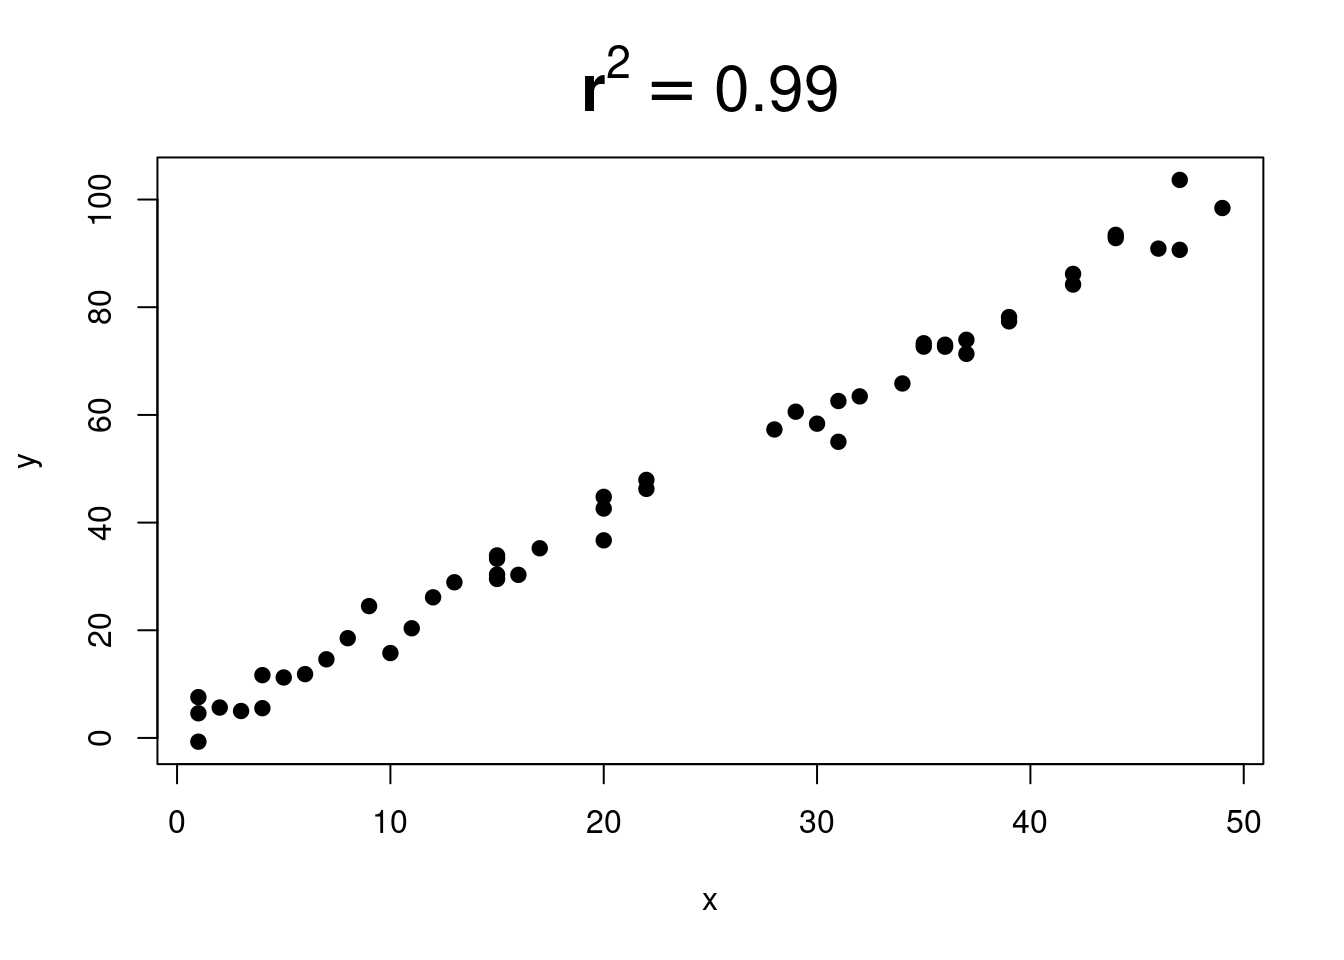
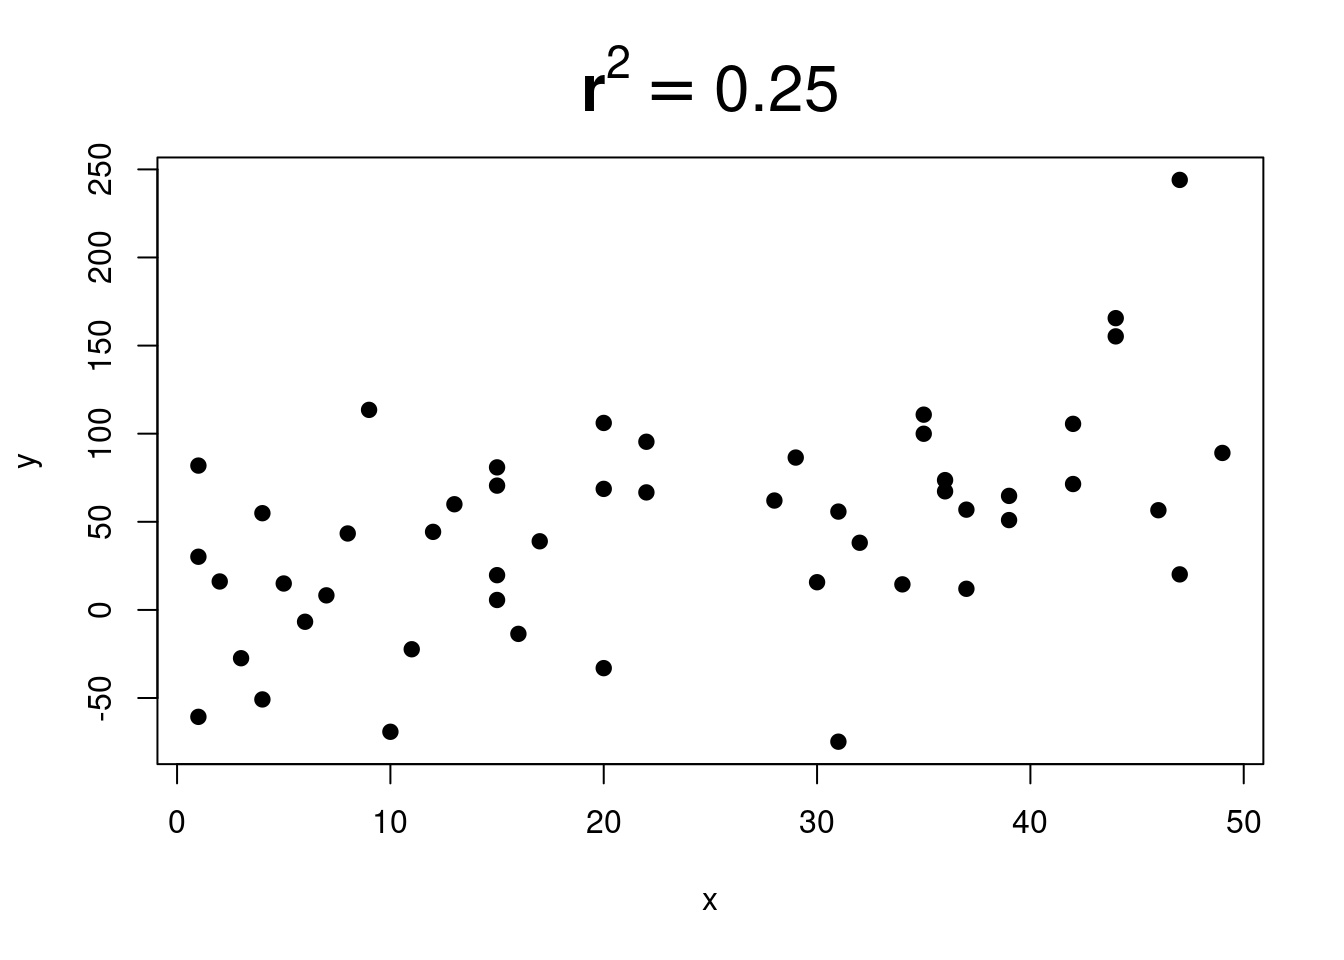
Here are some pictures that show different \(r^2\) values:
Gradually more and more scatter.

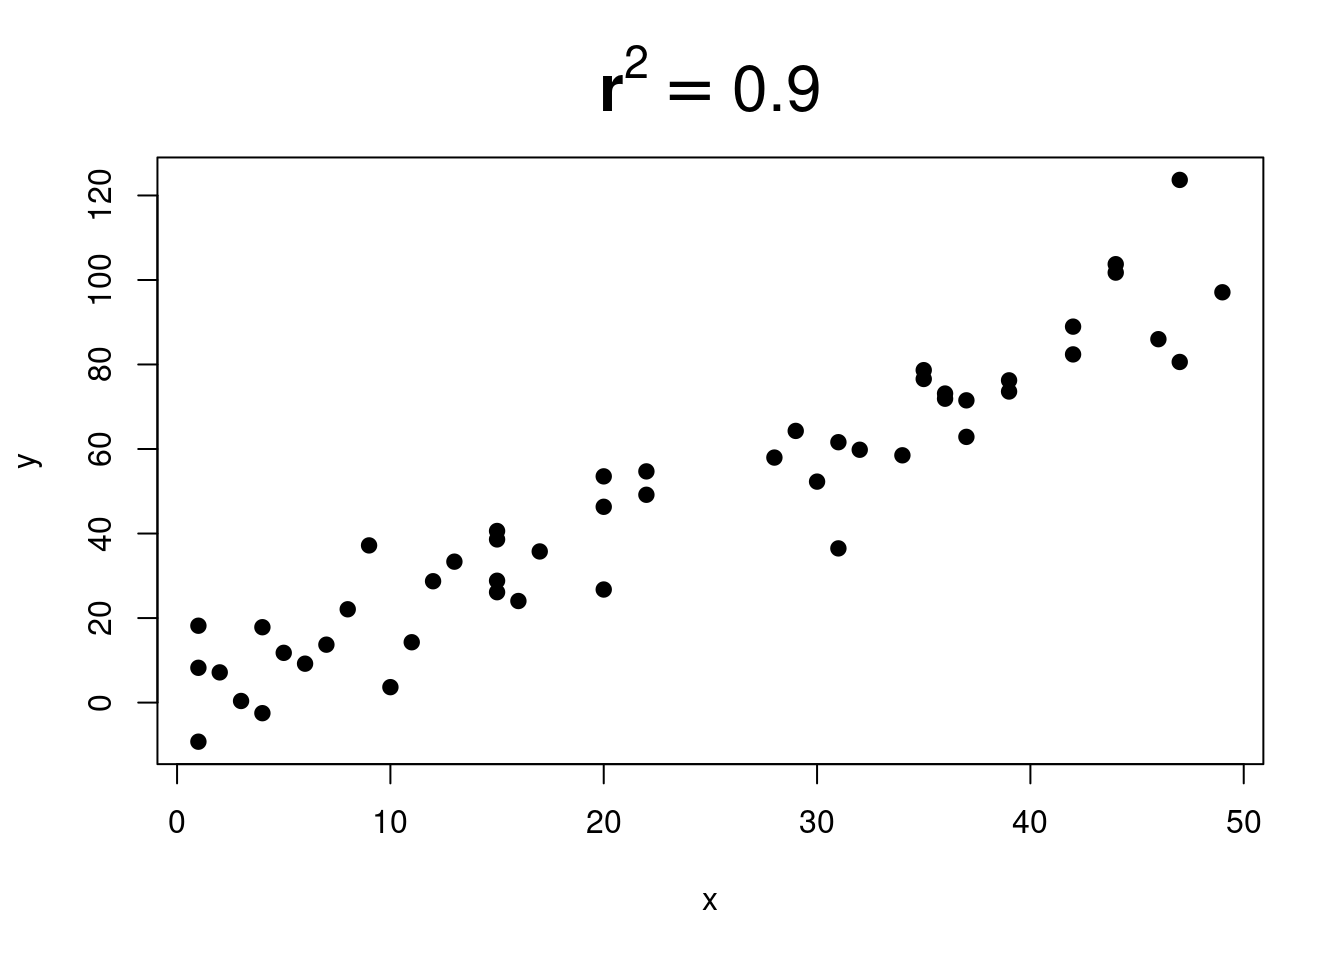
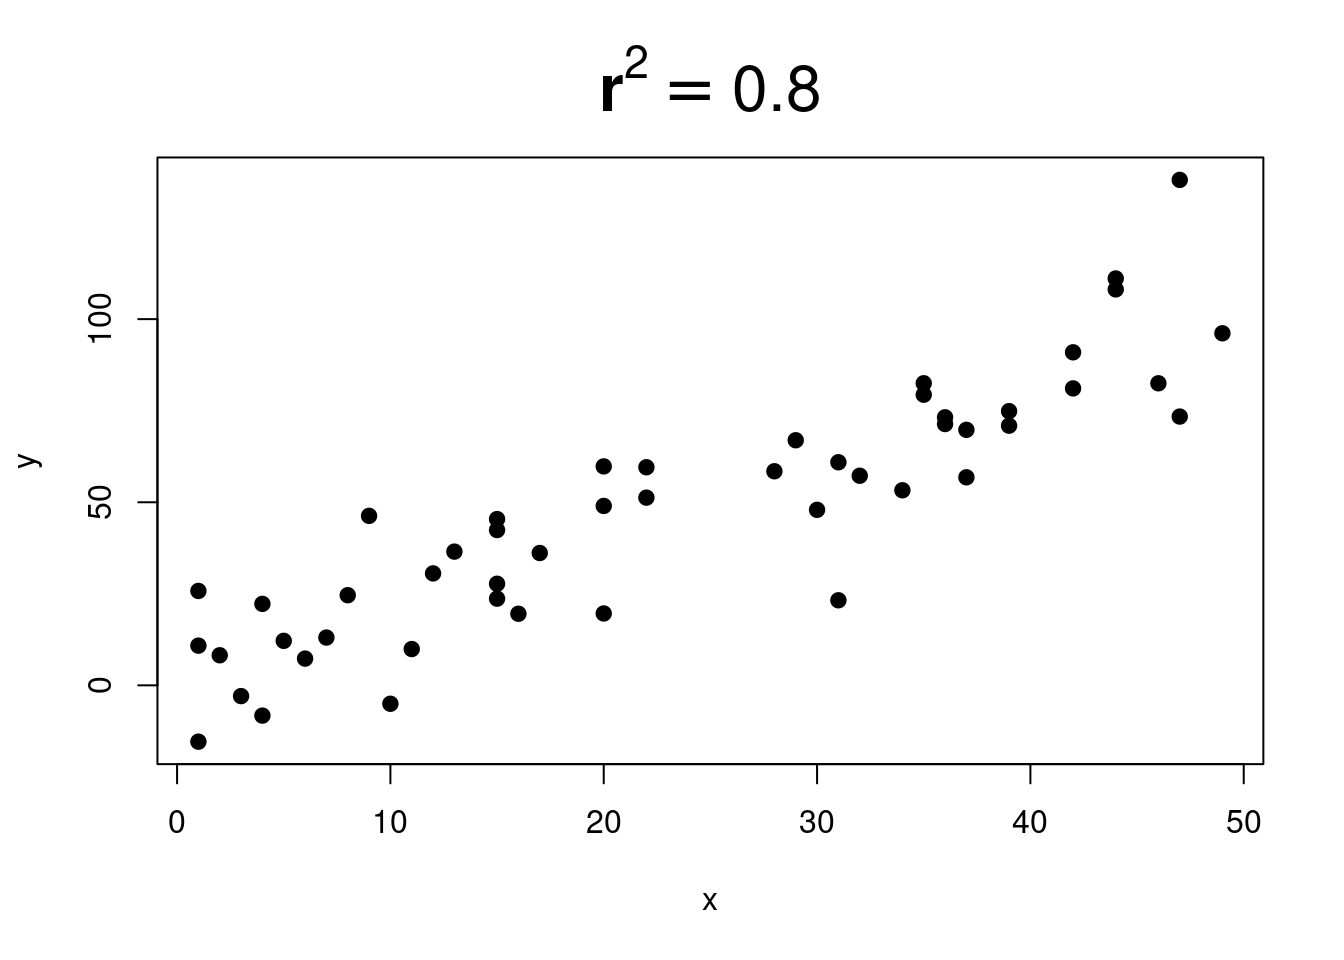
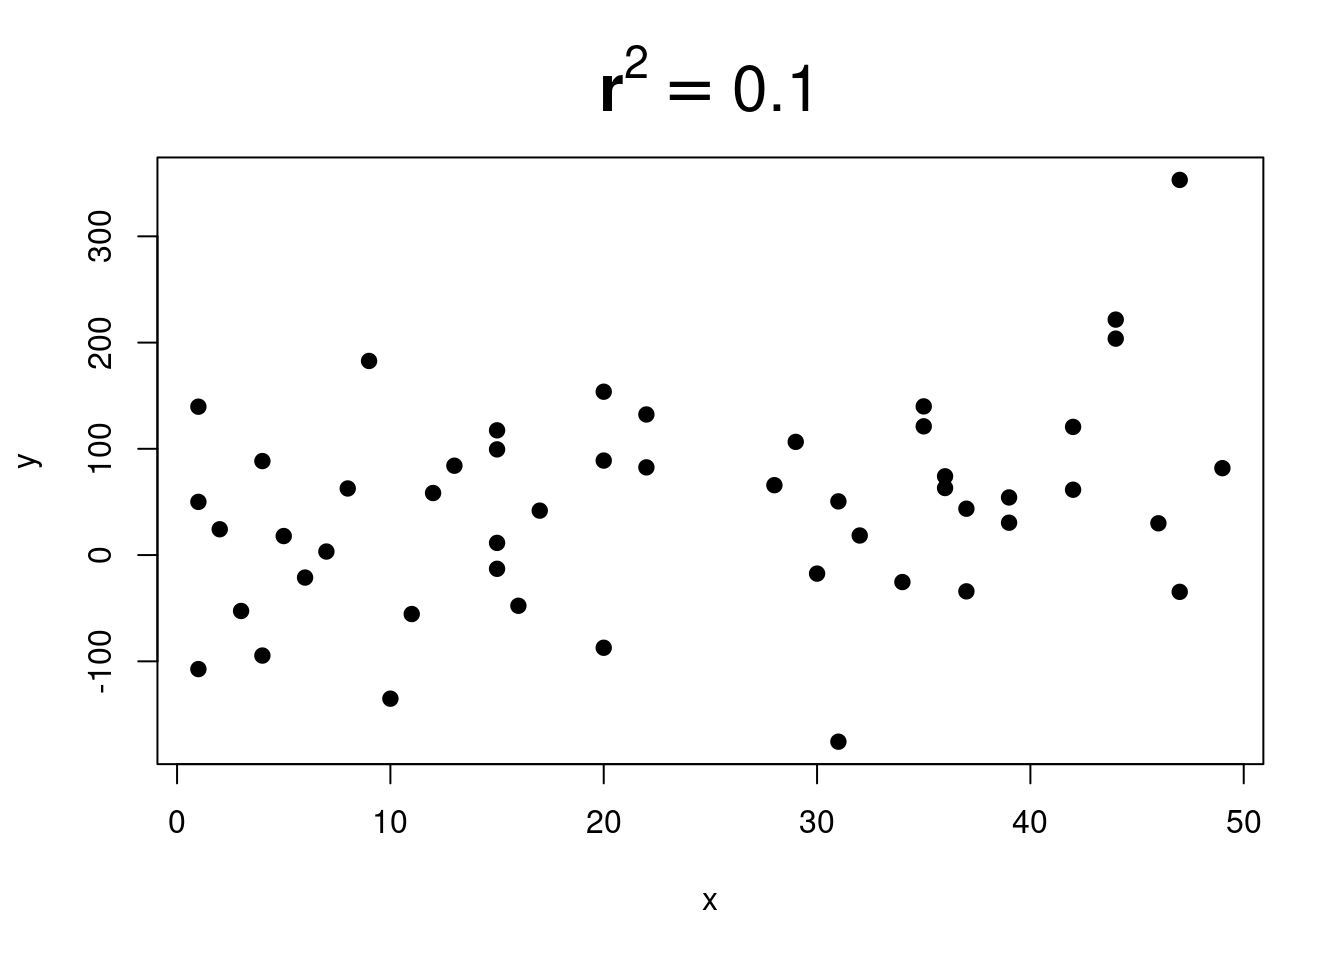
And more and more…


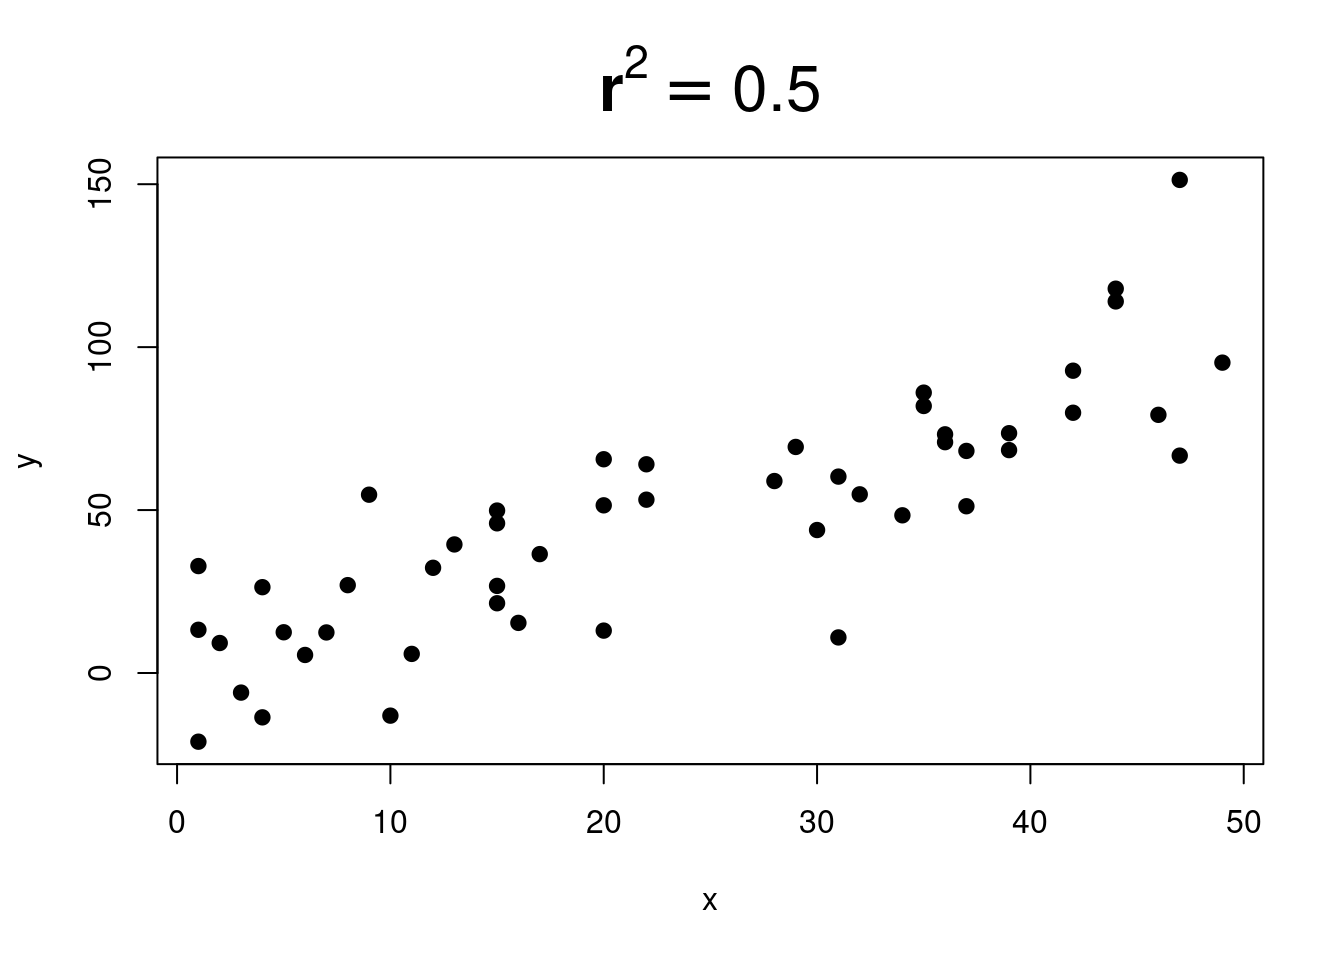
When \(r^2\) is close to \(0\), it is very difficult to see any trend:
\(r^2\) is sometimes called the explained variation.
This comes from this interpretation:
The idea is that some of the variation in y can be understood by using a linear regression model, but not all of it. The explained variation is just the notion of how good that linear regression model is.
So if you see this:
We won’t use this wording much in this book, but it comes up when people talk about and interpret regression results.